TechTalk: Power BI Workshop
Power BI is a free web-based application created by Microsoft that facilitate users to visualize data. Power BI is very useful for researcher, professional worker, or academics who are conducting research related with data. The data visualization result from Power BI is not only in static graphs but also it can be in interactive graphic that can be as media for communication or data presentation that displayed more attractive.
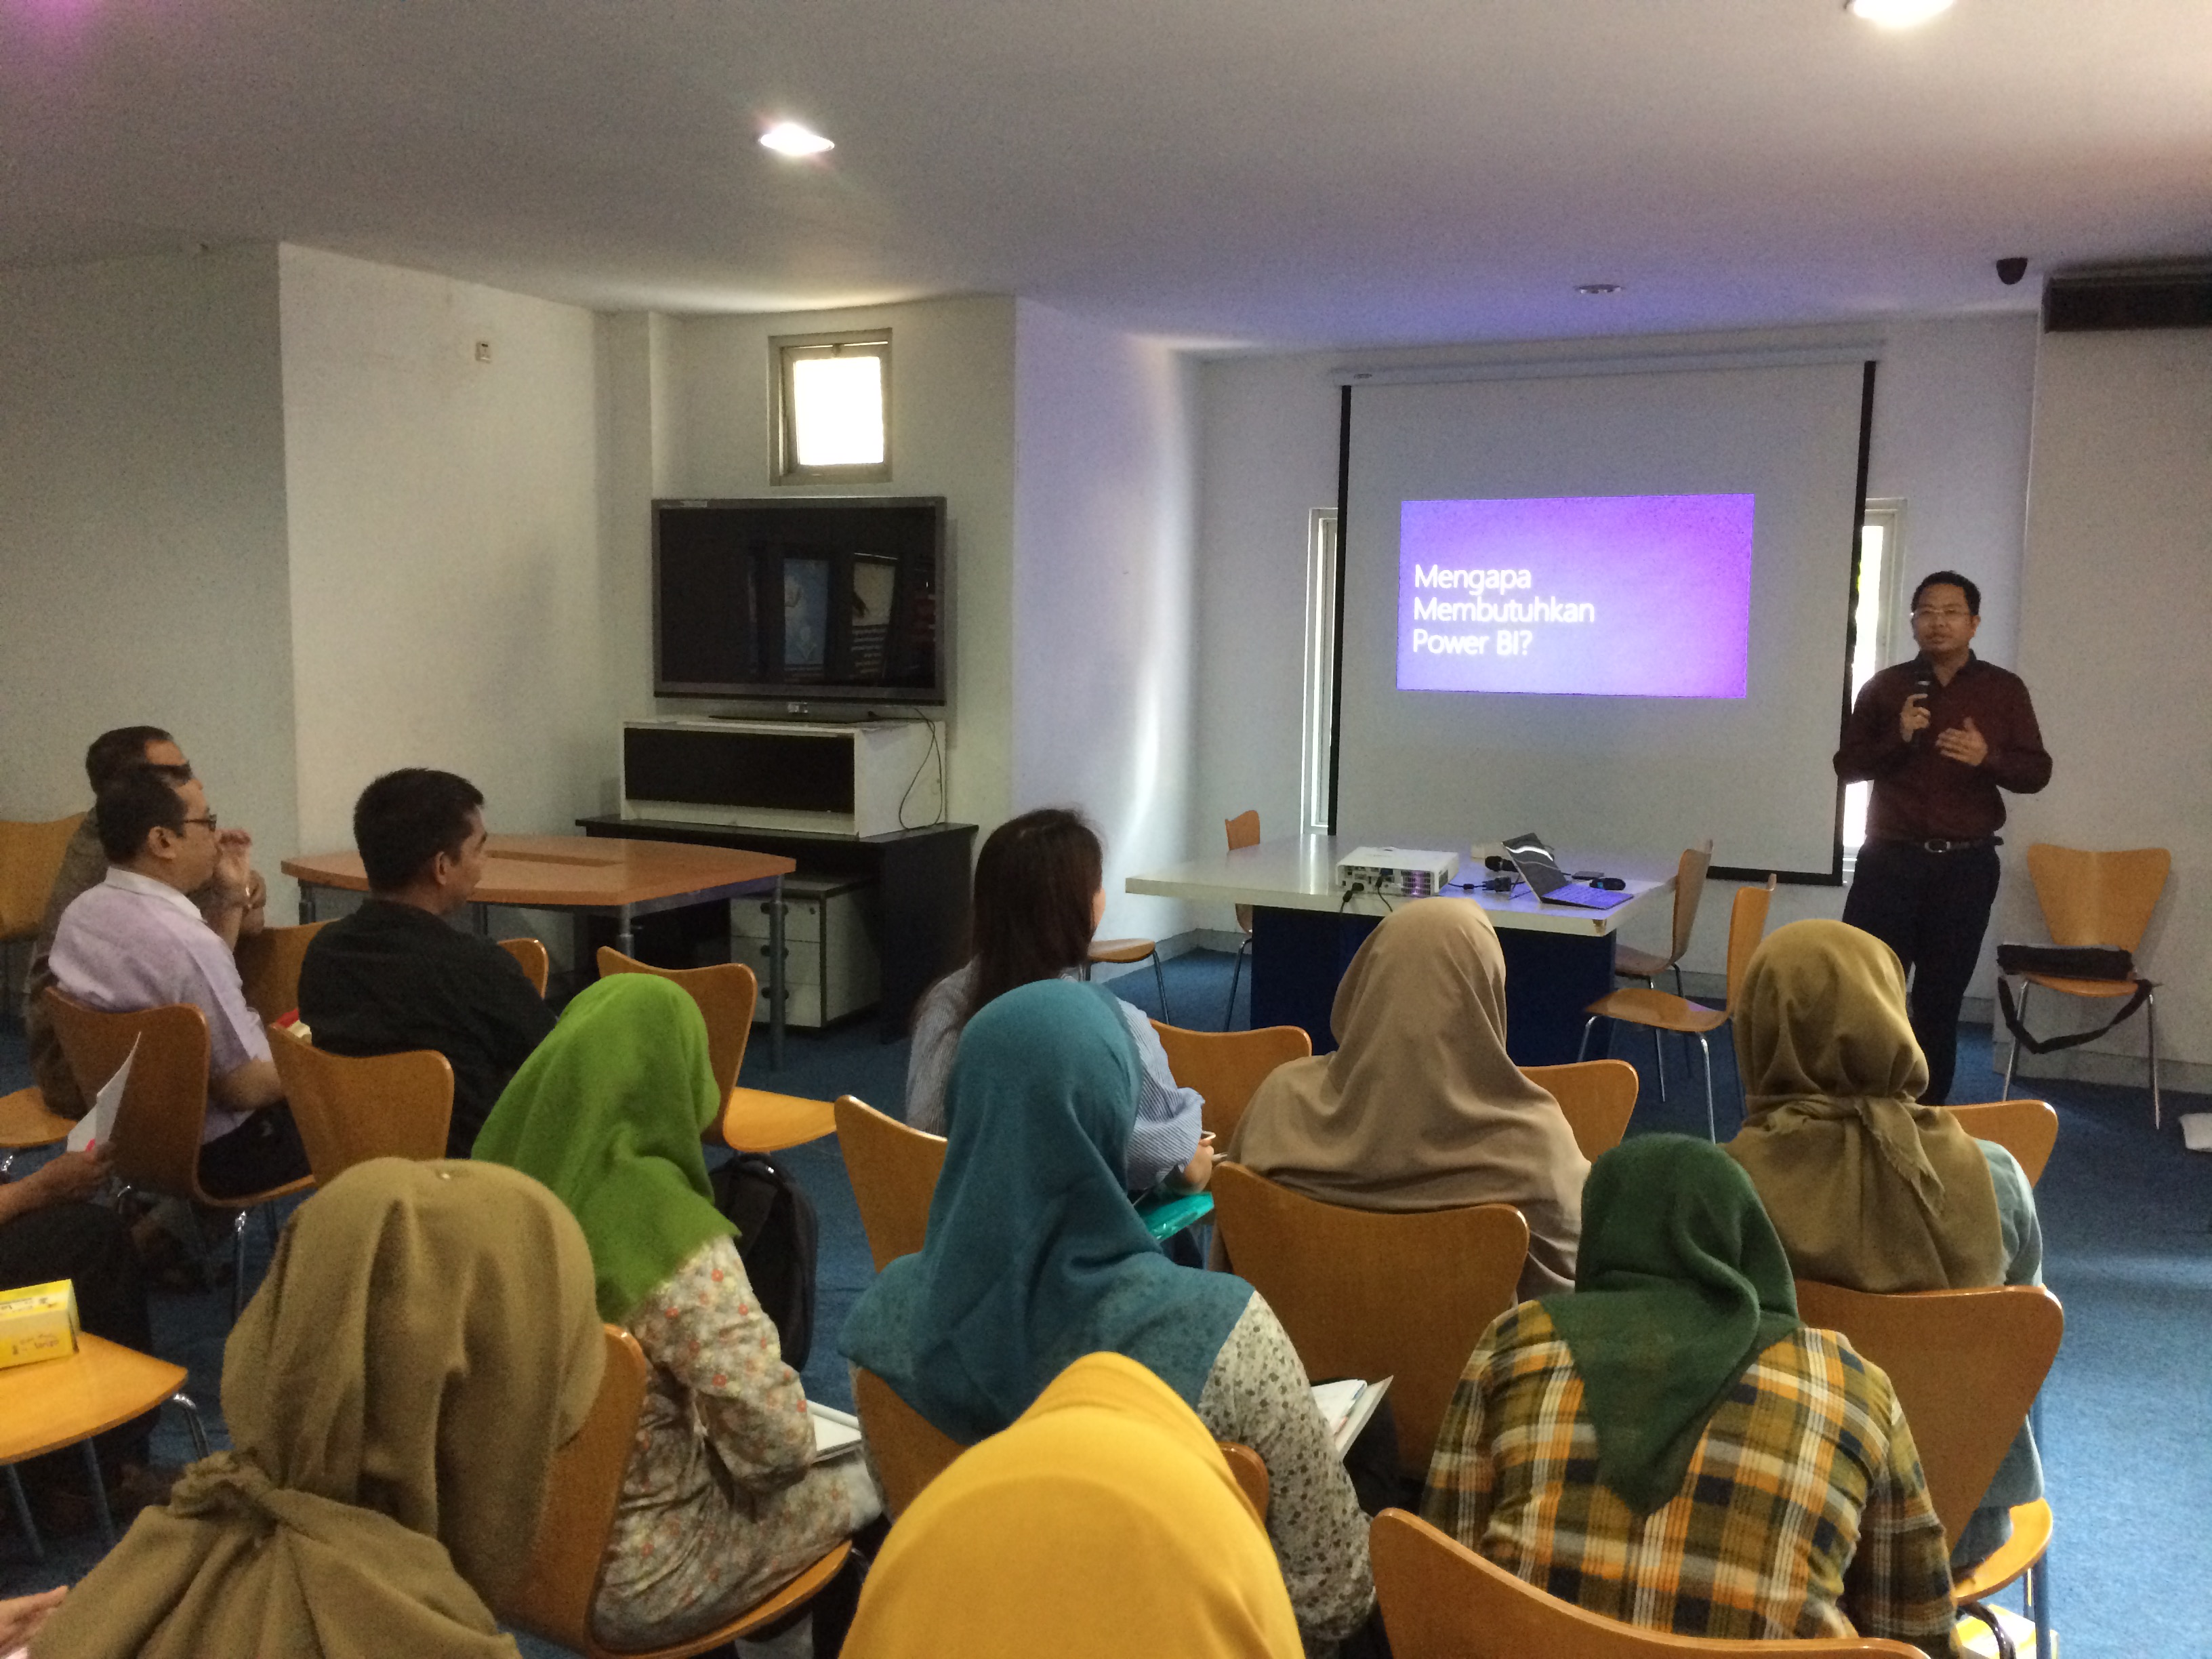
Based on these needs that relating to research activities, Microsoft Innovation Center tried to facilitate a mini workshop that discussed about Power BI. This event was held on October 19, 2016 at E-Library, Faculty of Engineering UGM. In this workshop, the participants learned about Power BI and its features and how to use Power BI. This workshop was led by Ridi Ferdiana as a facilitator.
This workshop provided the main agenda that covered about Power BI. At the beginning of the event, the facilitators opened with a description of data visualization: What is it and why it matters. Afterward, the event was continued with the introduction of Power BI. After the participants got an understanding about Power BI, this event was followed by Power BI demo. The facilitator also provided an explanation about Power BI Development Tools. Lastly, this event was closed with question and answer session.
By attending this workshop, the participants are expected to create their research with the tool from Microsoft such as Power BI. In addition, the participants can accommodate his/her research not only in the form of static graphics, but also they can create interactive graphs. This tool is very useful as a media to communicate and conducting an attractive presentation.
Latest News
- Pelatihan Microsoft Word Tingkat Mahir
- Global Microsoft 365 Developer Bootcamp 2020
- Critical Thinking with Visual Studio
- Cloud Computing for Higher Ed Workshop
- Product Talks 101: Handling Product with Scrum
- Road to Be A Data and AI Ninja Session - Learning How to Code in Python
- Training of Trainer - PowerPoint as Digital Teaching Materials in The Virtual Classroom of Microsoft Teams
- Data processing and management using Excel and SharePoint Online
- Monitoring the Progress of Teacher Training in Indonesia Using Microsoft Teams
- Training of Trainer – Learning Management System using Moodle and Microsoft Teams